LHC Post-Mortem System
Introduction
The Large Hadron Collider (LHC) at CERN is the most powerful particle accelerator in the world. Due to its complexity, ensuring operational reliability and safety is critical. The LHC Post-Mortem (PM) system was developed to meet these challenges by analysing transient data from a variety of systems during significant events such as magnet quenches, beam losses, or beam dumps.
What is the Post-Mortem System?
The Post-Mortem system is a set of services designed to handle data collected during critical LHC events. It processes inputs from diverse equipment, such as:
- Interlocks: Mechanisms that ensure safety by interrupting operations under unsafe conditions.
- Power Converters: Devices responsible for delivering precise electrical power to magnets and other systems.
- Beam Instrumentation: Tools used to monitor and measure beam dynamics.
The LHC Post-Mortem system collects data from thousands of devices not only during failures like beam aborts or equipment malfunctions but also during every beam dump. This data is then analized, enabling client applications to:
- Root Cause Identification: Understand the chain of events that led to a failure, such as detecting the initial trigger of a magnet quench or beam loss.
- System Validation: Ensure the proper functioning of machine protection systems and their redundancy mechanisms.
By automating these analyses, the system reduces the time needed to identify and resolve issues, enabling faster recovery and more reliable operation.
Architecture
How Does It Work?
The LHC Post-Mortem system operates through several key stages:
-
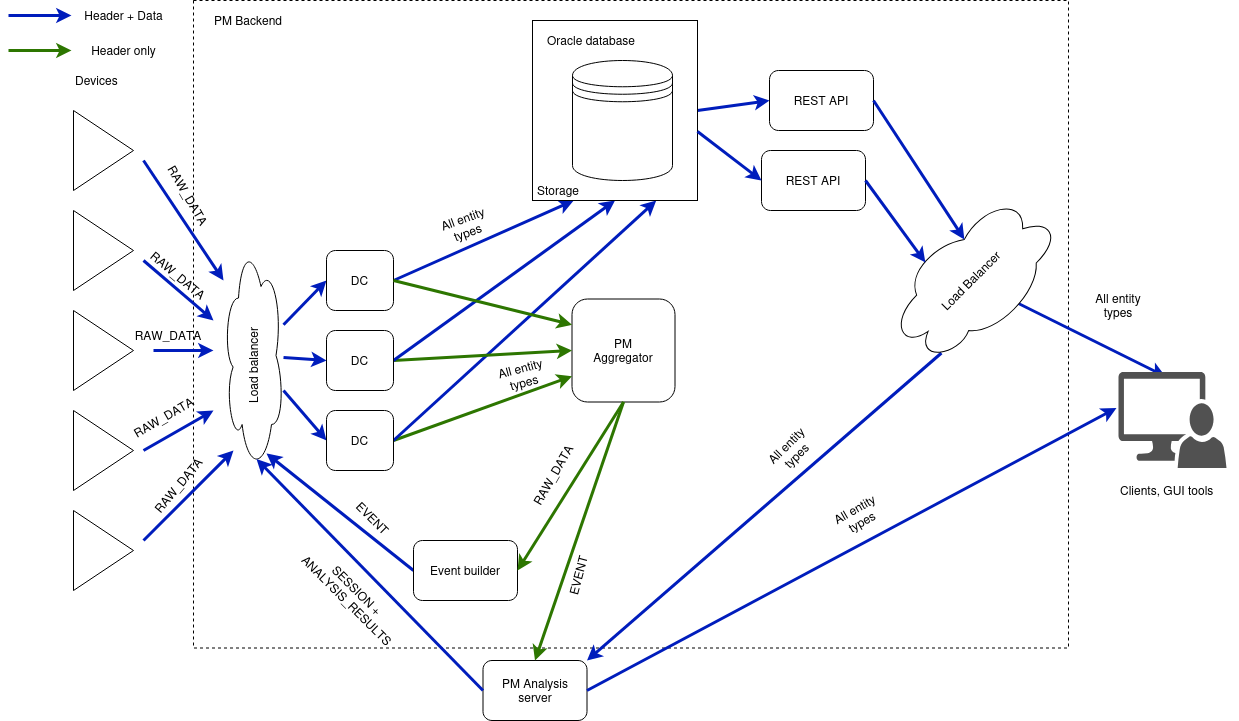
Data Collection: A redundant set of services collects transient data from multiple client systems. In the case of a beam dump, it stores thousands of data dumps within seconds in an Oracle database, and streams them for online processing.
-
Event Building: The system identifies significant events (such as beam dumps or localised equipment failures) by processing the incoming data stream using trigger timestamps and other criteria.
-
Analysis: Once an event is created, a series of analysis modules are executed automatically on the Post-Mortem Analysis servers, maintained by the BE-CSS-CPA group. Most of these modules are maintained by our team and are programmed in Java. They process the collected data to present the status of the machine at the time the event was generated.
-
Data Access and Result Presentation:
-
Post-Mortem Analysis GUI: Analysis results are provided by this GUI, which is also maintained by the BE-CSS-CPA group. This graphical user interface is the main way users, such as LHC operators, access the results and data from the Post-Mortem System. It allows operators to review findings in real time or during offline analysis. This tool is used to access the GUIs of each Analysis Module (which we maintain).
-
REST API: We expose data regarding the raw data dumps, events, and analyses through a REST API. This API enables programmatic access to the Post-Mortem data, allowing for integration not only with PMA but also with other tools and systems for offline analysis.
Analysis Modules We Maintain
Our team maintains several analysis modules that process specific types of data. These modules are crucial for interpreting the complex data generated during LHC events. Below is a list of the types of data analysed by these modules:
- Beam Loss Monitor (BLM)
- Beam Interlock Controller (BIC)
- Powering Interlock Controller (PIC)
- Warm Magnet Interlock Controller (WIC)
- Beam Position Monitor (BPM)
- Beam Power Loss
- Tune Analysis
- Function Generator/Controllers (FGC)
- Safe Machine Parameters (SMP)
- Fast Magnet Current Change Monitors (FMCM)
- Quench Heater Discharge Analysis (QHDA)
- PM Quench Protection System (QPS) 13kA and 600A
Technologies
- Java: Used for client libraries and all the back-end services (using Spring Boot)
- Java Swing: Used for graphical user interfaces
- C++: Used for client libraries
- Oracle Database: Stores all transient data, events, and analyses collected by the system.
- Prometheus, OpenSearch, Kibana, Grafana: Used for monitoring and tracing
- Ansible: Used for automated deployment